

Dust Sensor
[nextpage title=”Introduction” ]Introduction :
In this tutorial, we’ll focus on how to get your Sharp Optical Dust Sensor to work and what to watch out for.
In addition, we will try to provide Indian shop references and prices in Ruppes where possible.
[/nextpage]
[nextpage title=”Components” ]
Components
- Arduino Fio (Robotiik) –
- FTDI Basic Breakout 3.3V (Robotiik)
- Sharp Optical Dust Sensor (Robotiik)
- 6-pin TE 1.5mm pitch connector cable (Robotiik)
- 220 uF Capacitor
- 150 Ω Resistor
- Breadboard (Robotiik)
- M/M jumper cables
[/nextpage]
[nextpage title=”Setup” ]
Setup
Prerequisites
- Able to upload sketches via the Arduino IDE to your Arduino
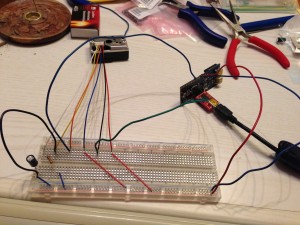
In the figure below you can see the overall setup using an Arduino Fio and the Sharp Dust sensor using a classical Breadboard.
Even though you may use an Xbee shield to load your sketches wirelessly, we use a FTDI breakout board here to connect to our PC.
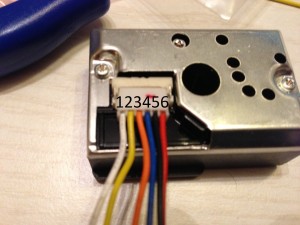
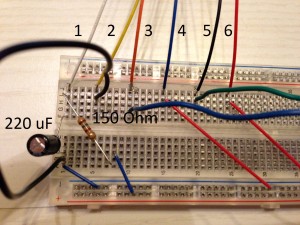
- Hook up the sensor using the 6 pins in the following way (see Figure below):
[/nextpage]
[nextpage title=”Schematic ” ]
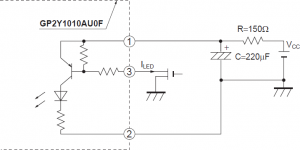
You may use the following schema from Sharp and our own drawing to help you in the task:
Pins Assignments
| Sharp Dust Sensor | Attached To |
|---|---|
| 1 (V-LED) | 3.3V Pin (150 Ohm in between) |
| 2 (LED-GND) | GND Pin |
| 3 (LED) | Digital Pin 12 |
| 4 (S-GND) | GND Pin |
| 5 (Vo) | Analog Pin A6 |
| 6 (Vcc) | 3.3V Pin (Direct) |
[/nextpage]
[nextpage title=”Code” ]
Code
Before launching the code, there are couple of points which are important.
1. How to interpret the output signal
In the figure below taken from the datasheet, you can see that the Dust density grows linearly with respect to the output voltage (Vo).
In line 52 of the code, we implemented the formula of the linear regression that approximatively follows this curve (courtesy of Chris Nafis).
This will allow us to map output voltages to Dust densities in mg/m³.

In addition, on an Arduino, any analog pin will map voltages between integer values from 0-1023 which can be mapped back to a “real” voltage value.
For the Fio, we therefore multiply the analog reading by 3.3/1024.0 and for the Uno, you will want to multiply the reading by 5.0/1024.0.
Important: Be sure to add the trailing zero in these calculations, because if you do not put at least one, you will end up with a nasty bug where all your results will be 0. (Hint: integer division in C)
2. Sampling times
According to the datasheet, we need to switch on the internal LED and wait for 280 µs (microsecond) before measuring the output signal and the duration of the whole excitation pulse should be 320 µs.
We therefore pause for another 40 µs before switching off the LED again.


|
1
2
3
4
5
6
7
8
9
10
11
12
13
14
15
16
17
18
19
20
21
22
23
24
25
26
27
28
29
30
31
32
33
34
35
36
37
38
39
40
41
42
43
44
45
46
47
48
49
50
51
52
53
54
55
56
57
58
59
60
61
62
63
64
|
/* Standalone Sketch to use with a Arduino Fio and a Sharp Optical Dust Sensor GP2Y1010AU0F*/int measurePin = 6;int ledPower = 12;int samplingTime = 280;int deltaTime = 40;int sleepTime = 9680;float voMeasured = 0;float calcVoltage = 0;float dustDensity = 0;void setup(){ Serial.begin(9600); pinMode(ledPower,OUTPUT);}void loop(){ digitalWrite(ledPower,LOW); // power on the LED delayMicroseconds(samplingTime); voMeasured = analogRead(measurePin); // read the dust value delayMicroseconds(deltaTime); digitalWrite(ledPower,HIGH); // turn the LED off delayMicroseconds(sleepTime); // 0 - 3.3V mapped to 0 - 1023 integer values // recover voltage calcVoltage = voMeasured * (3.3 / 1024); dustDensity = 0.17 * calcVoltage - 0.1; Serial.print("Raw Signal Value (0-1023): "); Serial.print(voMeasured); Serial.print(" - Voltage: "); Serial.print(calcVoltage); Serial.print(" - Dust Density: "); Serial.println(dustDensity); delay(1000);} |
Running
This snippet was captured using an Arduino Uno. While the setup works with an Arduino Fio, we noticed that we are not able to reach all the values possible by the dust sensor. Looking at figure 3 above (the voltage / dust density graph) the Fio’s maximum signal was about 2V with a corresponding maximum dust density of .25 mg/m³. This is a tolerable limitation as the ambient air quality is unlikely to get that high unless you work in proximity to high airborne particle generating activities such as construction.
In the snippet below you can see that by using a 5V input, we are able to reach the maximum readings outlined by Sharp (around 3.75V, cf linear curve above) by completely blocking the sensor, eg we inserted a pen to simulate absolute horrific air (very dense). The values around 0.8-1V were our baseline in our office.
Whilst with a 5V input you will reach your max at around 3.75Vo, you will reach the maximum already at around 2.25 Vo with a 3.3V input.
We will try to use a 5V-3V logic converter breakout board on the Fio to see if similar results can be obtained.
The table below was obtained using an Arduino Uno, and as expected we reached full capacity on this device.
|
1
2
3
4
5
6
7
8
9
10
11
12
13
|
Raw Signal Value (0-1023): 170.00 - Voltage: 0.8330 - Dust Density: 0.0416Raw Signal Value (0-1023): 188.00 - Voltage: 0.9212 - Dust Density: 0.0566Raw Signal Value (0-1023): 22.00 - Voltage: 0.1078 - Dust Density: -0.0817Raw Signal Value (0-1023): 321.00 - Voltage: 1.5729 - Dust Density: 0.1674Raw Signal Value (0-1023): 767.00 - Voltage: 3.7583 - Dust Density: 0.5389Raw Signal Value (0-1023): 767.00 - Voltage: 3.7583 - Dust Density: 0.5389Raw Signal Value (0-1023): 767.00 - Voltage: 3.7583 - Dust Density: 0.5389Raw Signal Value (0-1023): 772.00 - Voltage: 3.7828 - Dust Density: 0.5431Raw Signal Value (0-1023): 768.00 - Voltage: 3.7632 - Dust Density: 0.5397Raw Signal Value (0-1023): 766.00 - Voltage: 3.7534 - Dust Density: 0.5381Raw Signal Value (0-1023): 767.00 - Voltage: 3.7583 - Dust Density: 0.5389Raw Signal Value (0-1023): 767.00 - Voltage: 3.7583 - Dust Density: 0.5389Raw Signal Value (0-1023): 767.00 - Voltage: 3.7583 - Dust Density: 0.5389 |
The table below is a readout using the 3.3V supply on the Arduino Fio. As you can, when simulating a completely polluted air, by inserting a pen in the hole, we max out at 2.06V which is equivalent to 250 ug/m^3. As mentioned above, we do not foresee to ever reach these kind of values in Luxembourg, so we will consider this to be acceptable. Keep in mind though that if you want to use this sensor with the full range on an Arduino Fio, you will need a DC-DC step-up/step-down converter in order to supply the 5V input.
|
1
2
3
4
5
6
7
8
9
10
11
12
13
14
15
16
|
Raw Signal Value (0-1023): 192.00 - Voltage: 0.62 - Dust Density [ug/m3]: 5.19Raw Signal Value (0-1023): 204.00 - Voltage: 0.66 - Dust Density [ug/m3]: 11.76Raw Signal Value (0-1023): 205.00 - Voltage: 0.66 - Dust Density [ug/m3]: 12.31Raw Signal Value (0-1023): 640.00 - Voltage: 2.06 - Dust Density [ug/m3]: 250.63Raw Signal Value (0-1023): 640.00 - Voltage: 2.06 - Dust Density [ug/m3]: 250.63Raw Signal Value (0-1023): 640.00 - Voltage: 2.06 - Dust Density [ug/m3]: 250.63Raw Signal Value (0-1023): 639.00 - Voltage: 2.06 - Dust Density [ug/m3]: 250.08Raw Signal Value (0-1023): 640.00 - Voltage: 2.06 - Dust Density [ug/m3]: 250.63Raw Signal Value (0-1023): 639.00 - Voltage: 2.06 - Dust Density [ug/m3]: 250.08Raw Signal Value (0-1023): 640.00 - Voltage: 2.06 - Dust Density [ug/m3]: 250.63Raw Signal Value (0-1023): 640.00 - Voltage: 2.06 - Dust Density [ug/m3]: 250.63Raw Signal Value (0-1023): 341.00 - Voltage: 1.10 - Dust Density [ug/m3]: 86.82Raw Signal Value (0-1023): 640.00 - Voltage: 2.06 - Dust Density [ug/m3]: 250.63Raw Signal Value (0-1023): 640.00 - Voltage: 2.06 - Dust Density [ug/m3]: 250.63Raw Signal Value (0-1023): 192.00 - Voltage: 0.62 - Dust Density [ug/m3]: 5.19Raw Signal Value (0-1023): 245.00 - Voltage: 0.79 - Dust Density [ug/m3]: 34.22 |
[/nextpage]
[nextpage title=”Conclusion” ]
Conclusion
The sensor seems to be quite sensitive and shows relatively consistent results. We suggest to define some ranges that define your air quality, eg from 0.5V-1V Good, 1V-1.5V Poor etc… but it is up to you to define this scale. We suggest getting a baseline in an as clean as possible environment and simulate the maximum by inserting (carefully) a pen filling the whole hole. With the boundaries you can discreetly map the values in between to your preference.
An annoying part is that we cannot reach the maximum using the 3.3V input on the Arduino Fio and had to use the Arduino Uno to reach what was written in the datasheet. We will update this post once we get our hands on a 3.3V-5V logic converter.
[/nextpage]
we hope you enjoyed this tutorial!


