

Coefficient of Fluctuation of Speed
The difference between the maximum and minimum speeds during a cycle is called the maximum fluctuation of speed. The ratio of the maximum fluctuation of speed to the mean speed is called coefficient of fluctuation of speed.
Let N1 = Maximum speed in r.p.m. during the cycle,
N2 = Minimum speed in r.p.m. during the cycle, and
N = Mean speed in r.p.m. = (N1+N2) / 2
∴ Coefficient of fluctuation of speed,
Cs = (N1-N2)/N = 2(N1-N2)/(N1+N2)
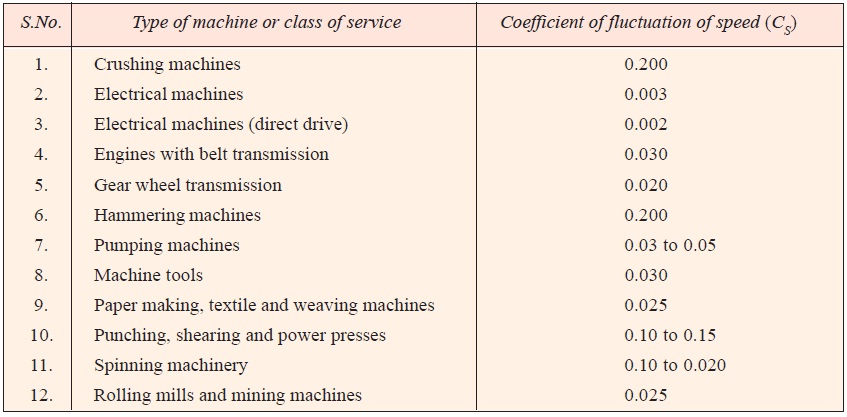
The coefficient of fluctuation of speed is a limiting factor in the design of flywheel. It varies depending upon the nature of service to which the flywheel is employed. Table 1 shows the permissible values for coefficient of fluctuation of speed for some machines.
Fluctuation of Energy
The fluctuation of energy may be determined by the turning moment diagram for one complete cycle of operation. Consider a turning moment diagram for a single cylinder double acting steam engine as shown in Fig. 1. The vertical ordinate represents the turning moment and the horizontal ordinate (abscissa) represents the crank angle.
A little consideration will show that the turning moment is zero when the crank angle is zero. It rises to a maximum value when crank angle reaches 90º and it is again zero when crank angle is 180º. This is shown by the curve abc in Fig. 1 and it represents the turning moment diagram for outstroke. The curve cde is the turning moment diagram for instroke and is somewhat similar to the curve abc. Since the work done is the product of the turning moment and the angle turned, therefore the area of the turning moment diagram represents the work done per revolution. In actual practice, the engine is assumed to work against the mean resisting torque, as shown by a horizontal line AF. The height of the ordinate aA represents the mean height of the turning moment diagram. Since it is assumed that the work done by the turning moment per revolution is equal to the work done against the mean resisting torque, therefore the area of the rectangle aA Fe is proportional to the work done against the mean resisting torque.
We see in Fig. 1, that the mean resisting torque line AF cuts the turning moment diagram at points B, C, D and E. When the crank moves from ‘a’ to ‘p’ the work done by the engine is equal to the area aBp, whereas the energy required is represented by the area aABp. In other words, the engine has done less work (equal to the area aAB) than the requirement. This amount of energy is taken from the flywheel and hence the speed of the flywheel decreases. Now the crank moves from p to q, the work done by the engine is equal to the area pBbCq, whereas the requirement of energy is represented by the area pBCq. Therefore the engine has done more work than the requirement. This excess work (equal to the area BbC) is stored in the flywheel and hence the speed of the flywheel increases while
the crank moves from p to q.
Similarly when the crank moves from q to r, more work is taken from the engine than is developed. This loss of work is represented by the area CcD. To supply this loss, the flywheel gives up some of its energy and thus the speed decreases while the crank moves from q to r. As the crank moves from r to s, excess energy is again developed given by the area DdE and the speed again increases. As the piston moves from s to e, again there is a loss of work and the speed decreases. The variations of energy above and below the mean resisting torque line are called fluctuation of energy. The areas BbC, CcD, DdE etc. represent fluctuations of energy. A little consideration will show that the engine has a maximum speed either at q or at s. This is due to the fact that the flywheel absorbs energy while the crank moves from p to q and from r to s. On the other hand, the engine has a minimum speed either at p or at r. The
reason is that the flywheel gives out some of its energy when the crank moves from a to p and from q to r. The difference between the maximum and the minimum energies is known as maximum fluctuation of energy.
Reference A textbook of Machine Design by R.S.Khurmi and J.K.Gupta


